The Landry 100 Explained
Click here to see the latest Landry 100.
What Is The Landry 100?
The Landry 100 is a hypothetical momentum list of up to 100 stocks. “$10,000” is placed into each position for a total of $1,000,000. Cash is treated as an “asset class.” In less-than-ideal conditions, there might be fewer than 100 stocks. Empty “slots” are filled with cash.
How Is It Created?
Stocks can only be added to the list if they make a new closing high. At this time (July 2025), the 52-week closing high is being used. However, if (or when!) conditions deteriorate, shorter-term highs (e.g., possibly 90-day highs) could be used.
The formula is quite simple: Today’s Close/The 52-week closing high. For Telechart, the formula is as follows: C/MAXC252, where C = Today’s Close and MAXC252 = the 52-week closing high. If the result = 1, then the stock has closed at a new closing high. The results of the scan are sorted by 50-day historical volatility.
What Stocks Make The Cut?
More volatile stocks, within reason, are given priority to fill the slots. Stocks that tend to trade more “cleanly” vs. those that bounce around are also given priority. Also, in general, stocks in the early phases of breaking out are given more precedent over those already making extreme short-term moves. However, there is no official “cut off” for being too overbought.
How Is It Managed?
The list is purely hypothetical, but it is “managed” in real time. Although some real-dollar experimenting is ongoing, the list should not be viewed as an actual investment. The goal is to show “proof of concept” (keep reading).
Underperforming stocks are removed from the list and replaced with stronger stocks. There is a constant “window dressing” to ensure that the list contains as many of the hottest momentum stocks as possible.
When there are a plethora of strong stocks, issues whose momentum has slowed (even if “profitable”) will be replaced by stronger stocks.
NO money management is used. In the real world, some sort of money management would be required. Profit taking should be considered along with some sort of damage control.
What’s The Point?
The point is to show “proof of concept.”
Through active “management” of the list, money flows are shown. You can see where the money is “stacking up.” At present, Gold and Industrial Metals are the two largest holdings. However, these numbers (as of 07/01/25) have recently begun to decrease since momentum is slowing in those areas. They are being replaced by technology in general (for reference, the Nasdaq and QQQ both closed at new closing highs on 06/30/25). Money flows during less than ideal conditions (e.g., early 2025) were into defensive issues (e.g., grocery stores). “Cash” slots also increased dramatically. During poor conditions, there is not “always a bull market somewhere.” Therefore, during these times, more and more slots will become cash (i.e., there will be significantly less than 100 stocks).
Nuances of momentum “play out.” Examples would be “momentum begets momentum:” RGC rallied over 3,000% after making new 52-week highs. And, momentum ends badly. The stock subsequently imploded and was removed from the list for a 1,772% gain. Yeah, that’s better than a poke-in-the-eye, but a significant portion of the gains were given up. Again, there is no money management. In the real world, with the stock becoming upwards of 30% of the entire portfolio, some rebalancing should have occurred.

Outliers are key. The secret to trend following is catching the occasional big homerun. Since its inception (it was “rebooted” in May of 2024), the closed positions amounted to a loss of $149,982. However, just the aforementioned RGC “trade” resulted in a gain of $177,240, thereby erasing those losses and then some.
Ride your winners, sell your losers. Through active management, strong stocks are kept in/added to the portfolio, and losers/those losing momentum are removed. This is why the closed trades will likely continue to show extended losses-at least until the occasional outlier comes along.
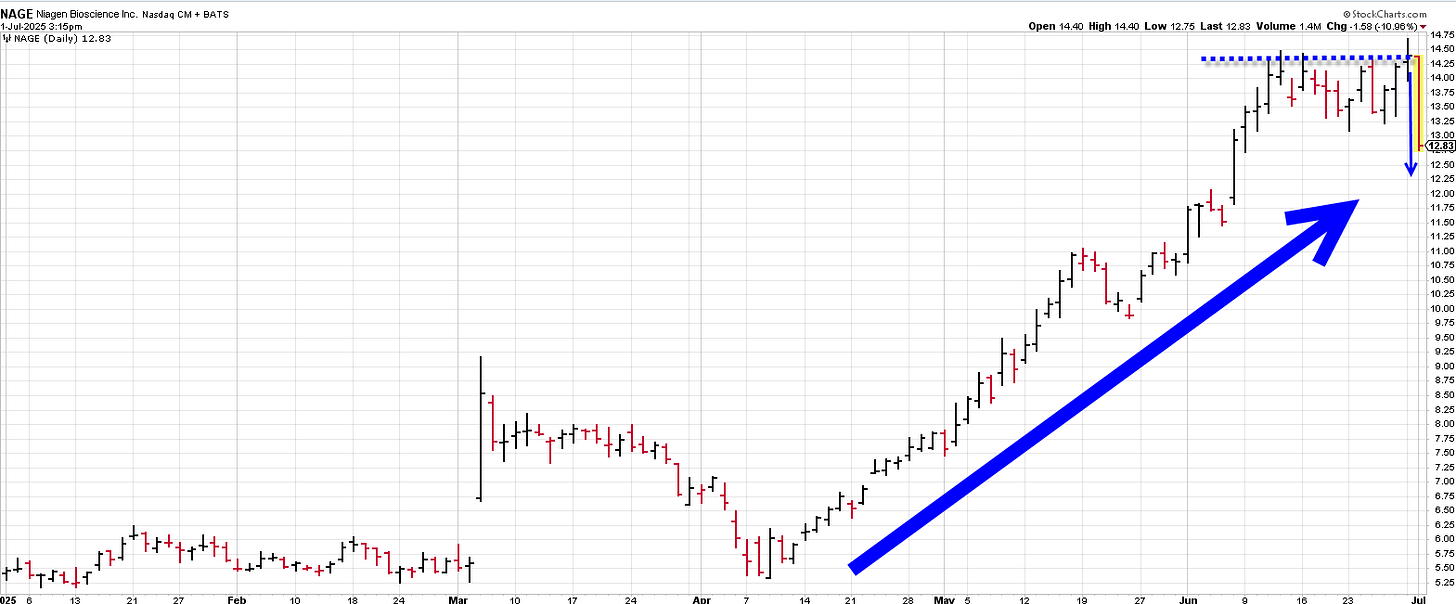
The list can provide potential setups. For me, that would be pullback-related patterns (e.g., Trend Knockouts, Landry Light Pullbacks, Persistent Pullbacks, etc…). It helps to ensure that great stocks are “on the radar.” Notice below that NAGE could set up soon as a “Double Top Knockout.”
The list often shows the nuances of momentum, such as momentum “getting whacked” first. Many of the stocks in the list will occasionally sell off hard, even though the indices are at or near new highs. When this occurs, the overall stock market usually follows shortly thereafter.
Breakouts, especially in this day and age, have a high failure rate. Therefore, trading a few here and there will not likely be profitable. However, if enough are bought (in this case, 100), the chances of catching some huge moves vastly increase.
Many stocks initially fail (hence the breakout failure rate) but later go on to trend nicely. And, obviously, some fail outright. Again, trading a few breakouts vs. a larger number (e.g., 100) would not likely be a successful strategy.
I’m exploring other possibilities such as intra-day trading.
In Summary
In a nutshell, it’s a great way to see money flows, provide potential setups, and watch the nuances of momentum play out-both good and bad.
For more information, become a paid subscriber to my Substack (davelandry.substack.com) for daily updates and watch my “Methodology In Action” series weekly on YouTube.
May the trend be with you!
Dave Landry


